UBC researchers develop mobile sensors to monitor urban gas emissions
March 1, 2017
March 1, 2017
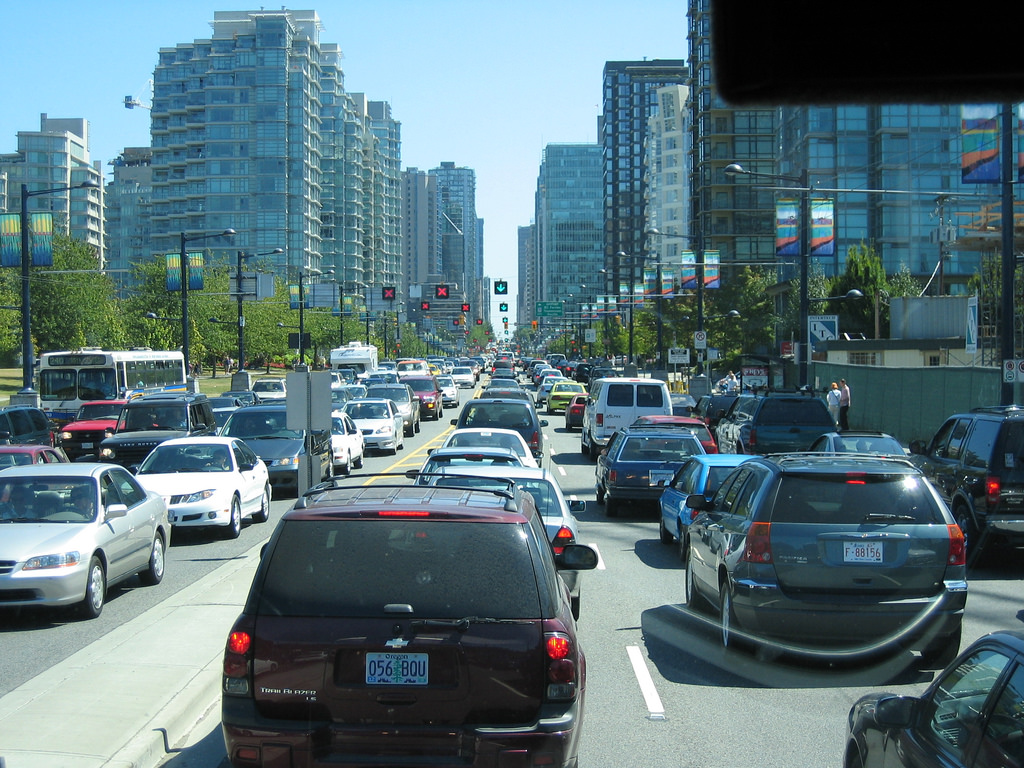
Cities play a key role in reducing greenhouse gas emissions to combat climate change, but directly measuring emissions remains a challenge. In a paper published today in Atmospheric Measurement Techniques, UBC researchers share a novel method they developed to map carbon dioxide emissions— the most important greenhouse gas emitted from cities—directly at street level.
Joseph Lee, the paper’s lead author and recent UBC graduate, and Andreas Christen, senior author and a professor in geography and the atmospheric science program, share how they developed the mobile sensors and what they found after attaching them to car-share vehicles in Vancouver.
JL: Our team developed these small, lightweight sensors so that they can be easily attached to vehicles as they drive through the city. We approached car2go about using five vehicles to test the sensors because it was important for us to show that the sensors are compact enough they could be attached to small vehicles like Smart cars. In fact, the sensors are so light that cyclists could even carry them on bikes.
AC: The purpose of the sensors is to measure the amount of carbon dioxide and the location at street level at any given time. We then compare the data to simultaneous measurements collected from sensors located on a tower above the city, which allows us to calculate where emissions are coming from. For example, if the concentration of carbon dioxide is, on average, much higher at street level than tower level, then we know the mobile sensors are located in an area of the city where emissions must be strong. Conversely, if the concentration is lower at street level than tower level, we are in an area where carbon dioxide is absorbed—by trees, for example—near the surface.
JL: On two afternoons, we drove the vehicles with the sensors attached for 3.5 hours in Vancouver. Unsurprisingly, we measured the highest emissions in downtown Vancouver and on some arterial roads. But we also found areas where carbon dioxide was absorbed, as in Stanley Park, and in some highly vegetated neighborhoods. Here we expect trees and vegetation to absorb more carbon dioxide than humans locally emit. Overall, the data measured by the sensors confirmed what we expected to find.
JL: What is novel about our method is that we are able to combine multiple mobile sensors with tower data, and to consequently map emissions across large areas of a city in high detail. Other researchers have previously attempted to measure carbon dioxide levels at street-level using mobile sensors, but were unable to translate their levels to emissions.
AC: Being able to accurately know how much and where greenhouse gas emissions are emitted in cities is important for planning reduction strategies. Governments typically model and report carbon dioxide emissions based on fuel statistics at coarse scales. But from a planning and policy perspective, there is a need to have fine-grained and detailed information how much emissions come from a specific street, block or neighbourhood and how emissions change over time.
For example, if cities take steps to reduce emissions, like introducing more electric or hybrid vehicles to transit systems, it’s important to be able to monitor and measure how effective emission reduction efforts are at the local level. Our mobile mapping technology could help to monitor emissions over time in high detail.
The research was funded by the Natural Sciences and Engineering Research Council of Canada, the Canada Foundation for Innovation, and the BC Knowledge Development Fund. Car2go provided the vehicles for the study, and the trips were funded by the moovel lab in Germany.
November 12, 2025
How the discovery of the first major lithium-bearing pegmatite in B.C.—and the geochemistry behind it—could help make Canada more self-sufficient in critica read more
October 22, 2025
New CRCs focus on software security, electrocatalysts for carbon recycling, isotope geochemistry, quantum systems, and AI-driven cellular health studies. read more
August 5, 2025
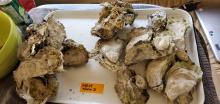
Scientists have discovered a previously unknown virus in farmed Pacific oysters during a mass die-off in B.C., Canada. The discovery serves as a reminder that growers should exercise caution when moving young oysters internationally and domestically, to prevent potential spread of pathogens,… read more
We honour xwməθkwəy̓ əm (Musqueam) on whose ancestral, unceded territory UBC Vancouver is situated. UBC Science is committed to building meaningful relationships with Indigenous peoples so we can advance Reconciliation and ensure traditional ways of knowing enrich our teaching and research.
Learn more: Musqueam First Nation