Opening up the data science classroom
January 24, 2023
January 24, 2023
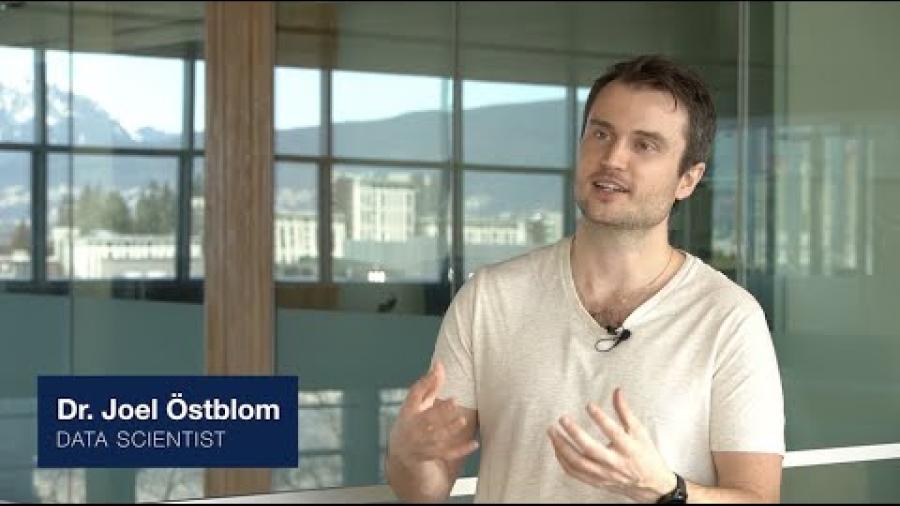
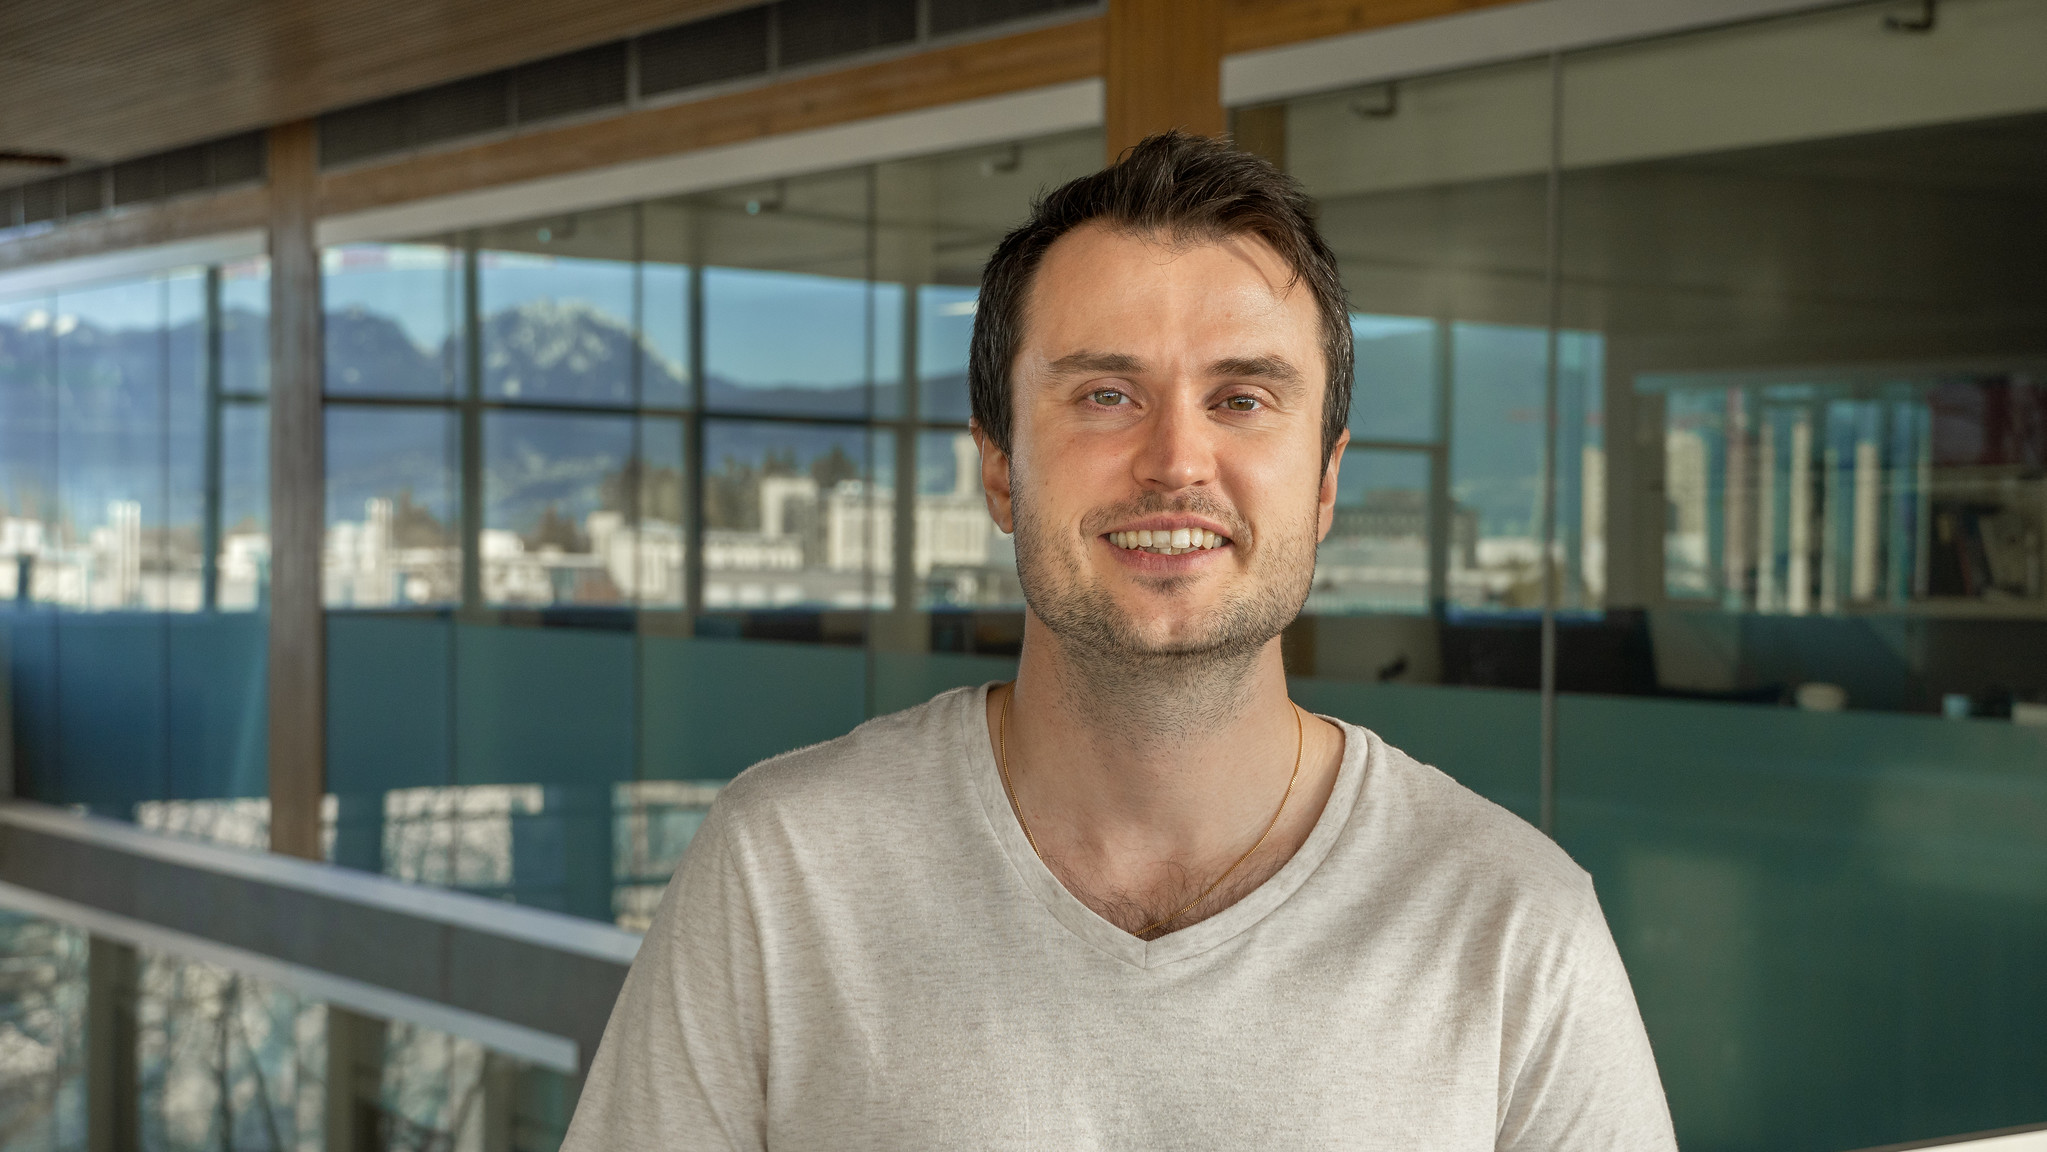
"Coming from a background where I was initially self-taught, I feel really close to the experience of students transitioning to data science from other disciplines and the challenges that these students face,” says Dr. Joel Östblom on his new role teaching data science at UBC.
Originally a biomedical engineering major, Dr. Östblom noticed a shift in his interests when he was introduced to programming during his PhD and discovered an affinity for for programmatic data analysis. He immersed himself with the help of online coding communities.
"I really enjoyed the communities that have developed around this. They're invested in open source and open access materials. They like spreading the tools and knowledge to make sure the science is done in a sound way, and that you interpret the data accurately. I resonated with the idea of open science and sharing tools freely with others."
As a new assistant professor of teaching, Dr. Östblom is now someone who is able to share his knowledge widely with his students. The professor of teaching role is a new classification at UBC, and one that prompted Joel to stay in Vancouver, as there were no similar university teaching positions in Sweden where he is from. When asked why he chose the teaching route, he mentions that he likes feeling the impact of being there with the students.
This year, he'll be teaching courses in data ethics and visualization. As much as the technical aspects of data science remain fundamental to his classes, Dr. Östblom also works with students to scrutinize the social implications underlying the data they work with.
Data visualization is the art and science of using graphical elements to communicate data so that it can easily be understood. Seeing raw data in a table is one thing, but humans are wired to process visual information more effectively. In every-day life, the average person interacts regularly with infographics, charts and graphs. They can come from different sources, like the news, social media and work.
"We try to have our students learn to understand what kinds of questions they need to ask when they see a visualization. What is the author of the visualization trying to show you? What aren’t they showing you? Is this intentional or not? These kinds of questions are very important because everyone interacts with data every day.”
Dr. Östblom also asks his students to focus on data ethics. Much like data visualization, there are both intentional and unintentional biases that can be incorporated into algorithms and other elements of programming that measure or manipulate data. Asking critical questions about the data can inform the technical decisions that are made to address issues.
“Some facial recognition algorithms work differently depending on your skin tone. This was highlighted a few years ago, so many of the companies adjusted their algorithms. This was a technical solution that could be applied to address the issues at hand,” says Dr. Östblom.
“As a data scientist, you can strive to be really accurate and fair in how you describe your algorithms and how you use methods to prevent some of these biases from happening in the first place.”
Dr. Östblom is looking forward to continue to help students get over data science hurdles.
“Especially with graduate students, I felt that I had similar learning frustrations as they did—with non-standardized tools and figuring out how to do certain analysis. Being able to help them out and making that difference is a special experience.”
Dr. Joel Östblom's faculty profile at UBC Master of Data Science
Dr. Joel Östblom's website
We honour xwməθkwəy̓ əm (Musqueam) on whose ancestral, unceded territory UBC Vancouver is situated. UBC Science is committed to building meaningful relationships with Indigenous peoples so we can advance Reconciliation and ensure traditional ways of knowing enrich our teaching and research.
Learn more: Musqueam First Nation


