What your tweets say about your commute
November 22, 2017
November 22, 2017
Urban planners need data on how people move around the city in order to improve transit service. But rider surveys can be costly and inefficient. With a focus on Surrey, B.C. and downtown Vancouver, UBC postdoctoral researcher Saeid Allahdadian developed a method that uses social media data to map major travel routes to reveal areas in need of better transit service. In this Q&A, he talks about his findings and what they could mean for urban planners.
I was part of a group with three other UBC students, Lap-Tak Chu, Mina Park and William Qi, that analyzed commuting patterns and public transportation needs in Metro Vancouver. This was for a data science project organized by UBC’s Data Science Institute and the Cascadia Urban Analytics Cooperative and sponsored by Microsoft. My colleagues analyzed the transit network and I studied patterns in social media data. UBC computer science professor Raymond Ng, who leads the Data Science Institute, supervised our work.
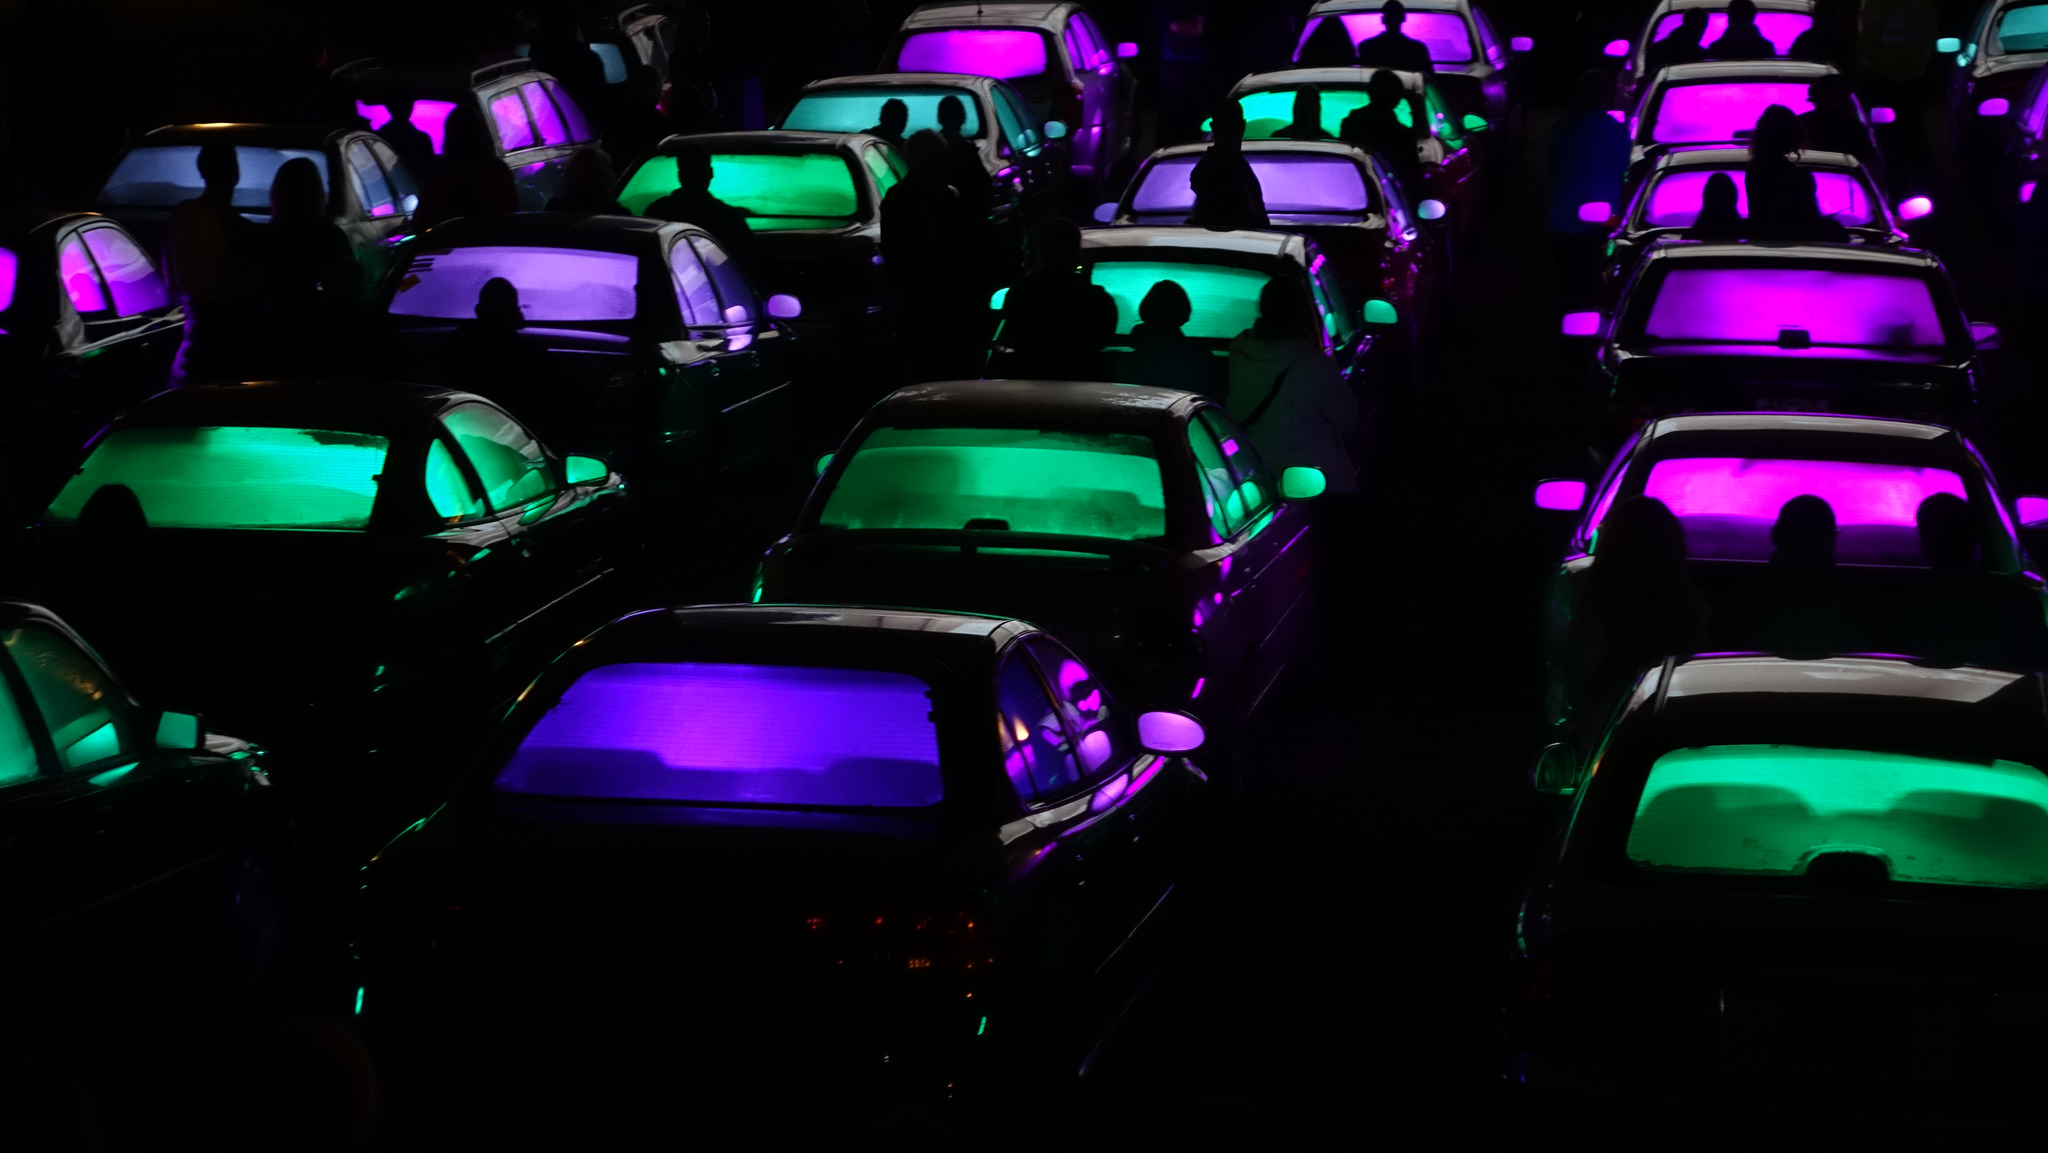
Twitter gives developers open access to its data, so I was able to analyze around 30,000 geotagged public tweets over a period of three weeks in the summer of 2017. These tweets were posted by 3,440 different individuals at various locations around Metro Vancouver.
Using machine learning—which enables computers to act and make data-driven decisions—I developed programs that could recognize and predict an individual’s movement patterns based on their different tweet locations throughout the day. I plotted these trajectories onto a map of Metro Vancouver, extracting travel routes out of thousands of separate commutes.
Results showed that the most popular travel routes are through downtown Vancouver, followed by downtown Vancouver to Surrey City Centre; Burnaby to downtown Vancouver; the Broadway corridor; Kingsway; and Langley to Surrey City Centre. When I examined travel times on public transit for these routes, I found that public transit generally matches up nicely with where the population is located.
However, there were exceptions. On the Langley-to-Surrey route, travel times can range up to 80 minutes, suggesting a need for faster, more frequent public transit.
Analyzing geotagged tweets can help transportation planners respond quickly to large events. If there’s a big sports event or concert and many people are heading downtown, transit can be redirected accordingly. If there’s a natural disaster, responders can prioritize the areas where people are concentrated.
The techniques used in this project can be customized for sparsely populated areas such as Surrey or high-density areas such as downtown Vancouver, as long as there is a sizable population of Twitter users.
There are limitations in this approach. Twitter users aren’t always willing to share information publicly. They also tend to be young and that can skew results. More research is needed to refine this approach to transportation modelling. That said, social media data shows a lot of potential to help urban planners, public transportation planners, and emergency responders do their jobs better.
October 22, 2025
New CRCs focus on software security, electrocatalysts for carbon recycling, isotope geochemistry, quantum systems, and AI-driven cellular health studies. read more

October 1, 2025
Large language models are more persuasive than humans: UBC computer scientist Dr. Vered Shwartz discusses safeguards for the future of AI. read more

September 2, 2025
Five UBC Science professors have been named Fellows of the Royal Society of Canada (RSC) for their research in the fields of atmospheric aerosols, marine ecosystems and fisheries, fast radio bursts, computer visualization, and human-computer interaction. Joining more than 60 UBC Science… read more
We honour xwməθkwəy̓ əm (Musqueam) on whose ancestral, unceded territory UBC Vancouver is situated. UBC Science is committed to building meaningful relationships with Indigenous peoples so we can advance Reconciliation and ensure traditional ways of knowing enrich our teaching and research.
Learn more: Musqueam First Nation