Predicting how plants will fare in the heat is not so easy
June 24, 2025
June 24, 2025
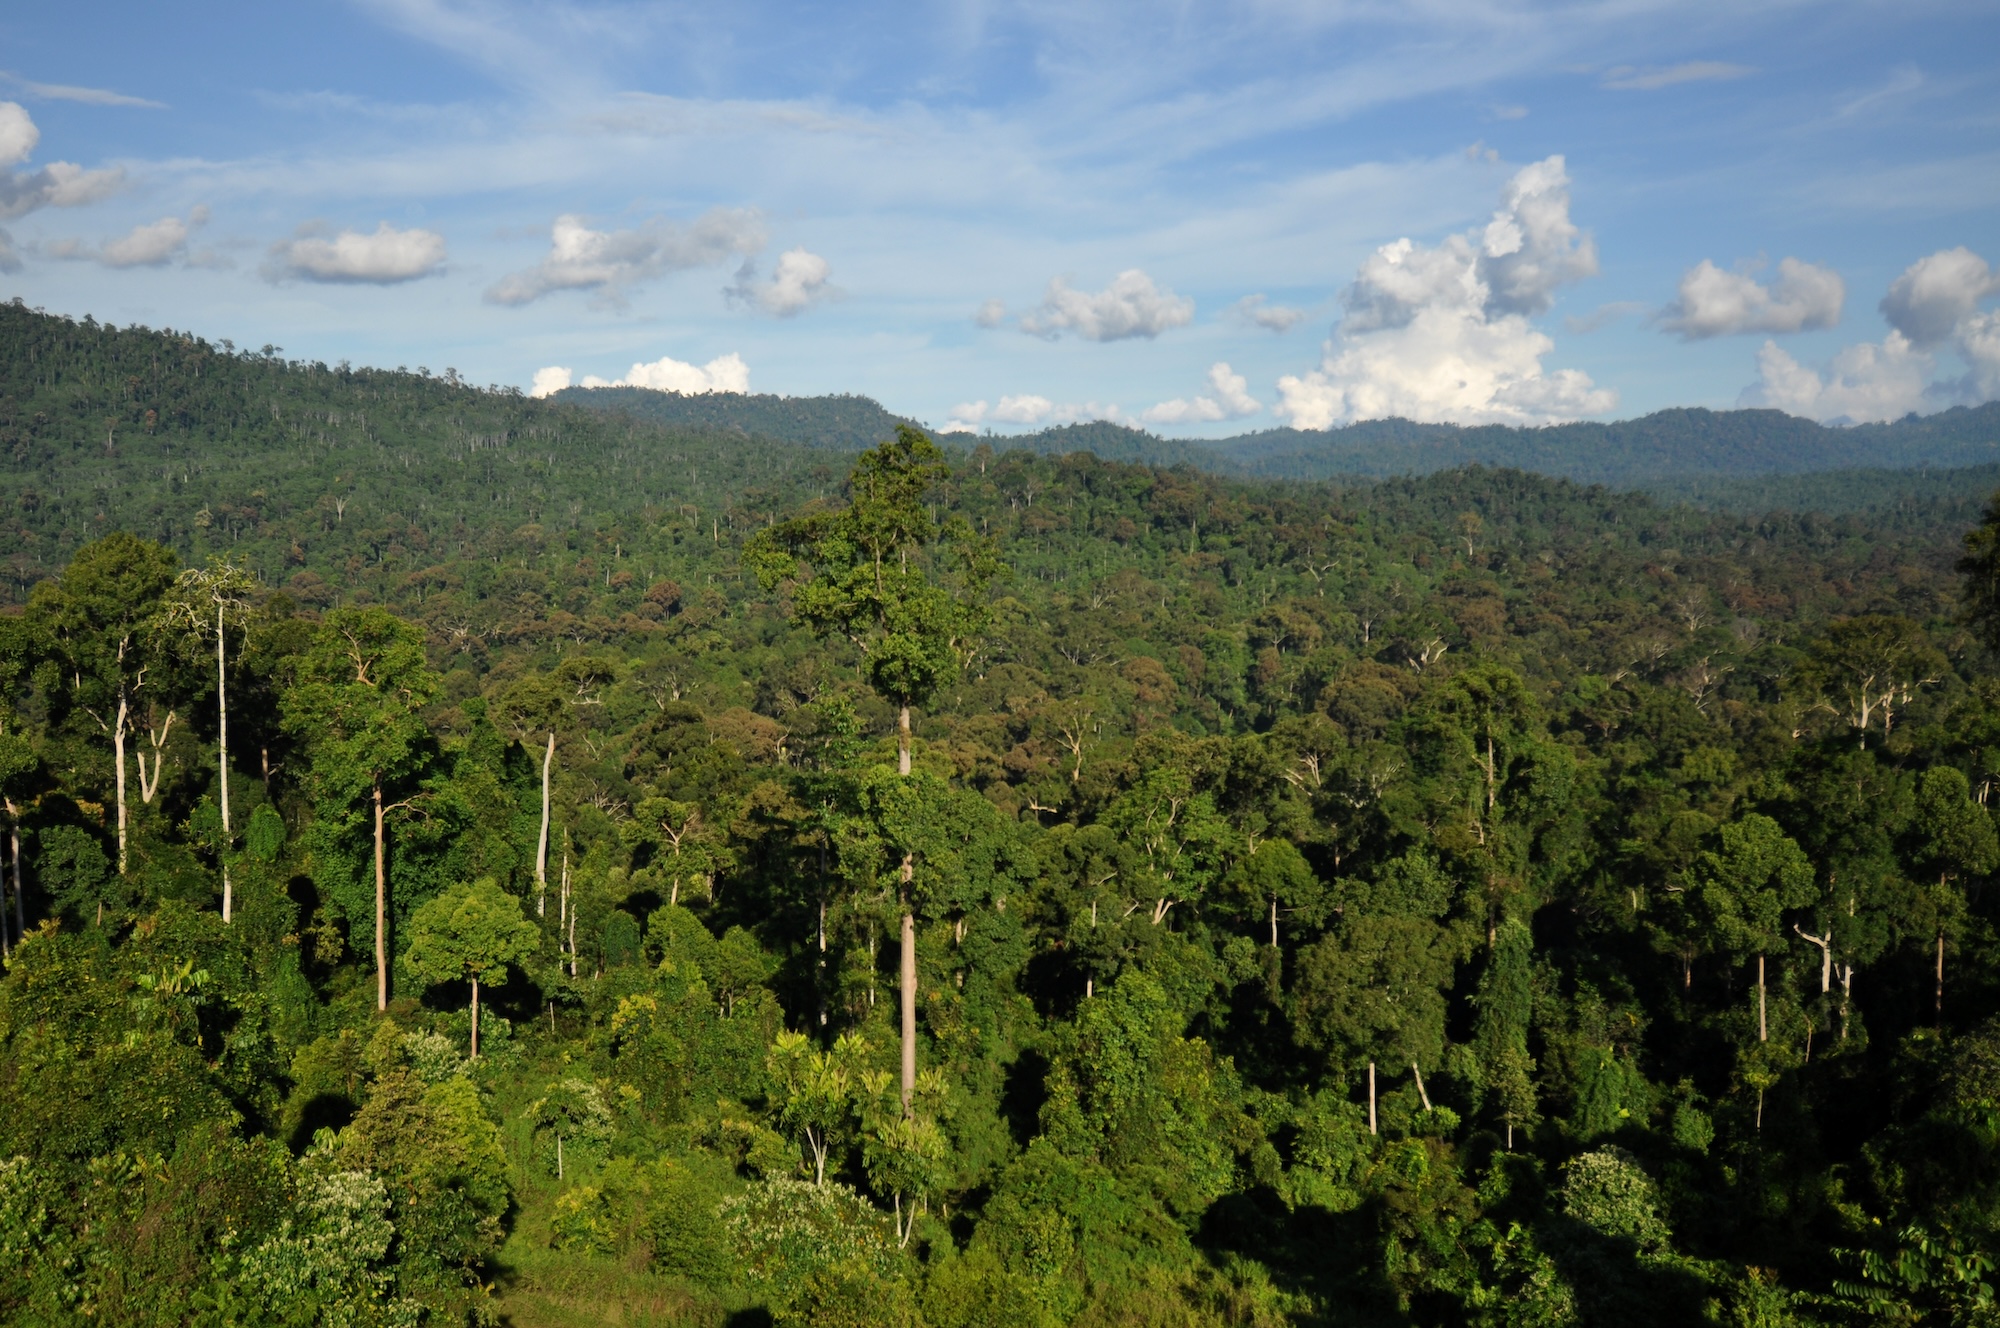
Anticipating how plants will respond to rising temperatures is critical—not just for plants, but for whole ecosystems. How organisms respond to heat is often studied at small scales—such the behavior of a single leaf or branch—and then extrapolated to predict what might happen across whole ecosystems.
But according to a new review article published in Science by researchers at the University of Arizona and the University of British Columbia (UBC), those small-scale observations don’t always translate into an accurate prediction at a larger scale.
For example, measuring water use at the leaf level doesn’t necessarily reflect how a whole plant, or forest canopy, will use water, making forecasting a challenge.
“The expectation is that in general, plants try to minimize water loss and maximize carbon gain. But there are some instances, especially during heat waves, where it’s beneficial for plants to lose water because it helps cool them down,” said Dr. Jia Hu, associate professor in the University of Arizona School of Natural Resources and the Environment.
“So, on one hand you would expect transpiration rates to decrease when plants experience increased heat, but there's examples where the evaporative cooling takes priority over any sort of carbon gain, and that's not really considered in a lot of models.”
The authors analyzed over 70 studies to gain a better understanding of how heat response predictions were made.
“We're trying to highlight a suite of examples where we make predictions that are in some cases off by a little bit, and in other cases off by a lot—sometimes even in the wrong direction, predicting a positive response when in fact there’s a negative one,” said Dr. Margaret Evans, associate professor in the Laboratory of Tree-Ring Research at University of Arizona.
An example of scale-related complexity happens in plant canopies, where leaves at the top of a forest canopy are often exposed to direct sunlight, heat, and greater water stress, which limits their ability to evaporate water and cool themselves compared to the shaded, less water-stressed, and cooler leaves below. This creates a vertical temperature gradient, meaning the same tree can experience different conditions throughout its height, making it difficult to scale up leaf-level data to predict whole-plant responses.
“One way we measure leaf temperatures is by aiming thermal cameras at the top of the canopy,” said UBC botanist Dr. Sean Michaletz. “But these cameras can only capture the leaves they see, which are almost always at the very top. That gives us an incomplete picture and usually means we overestimate leaf temperature. This matters because the cooler, shaded leaves lower down – which our cameras often miss – can contribute a lot to the canopy’s total carbon uptake.”
In another example, current spatial patterns of where a plant species grows today are used to project how it will respond to future changes in temperature. Because plants grow faster where it is warmer, this approach leads to the prediction that plants will benefit from temperatures rising over time. But warmer-than-average temperatures commonly lead to drought stress for plants, so they grow less, not more. In the long term, plants can adjust through evolutionary adaptation and colonization, but these can take a long time to happen.
“There are lots of plant mechanisms to deal with stress and adjust to climate change. But some of those processes are slow and the changes that are happening now are just really fast,” said Dr. Hu.
“There’s a mismatch in time scale between the pace of climate change that's happening now and the processes that have historically allowed plants to respond to climate variability of the past.”
October 16, 2025
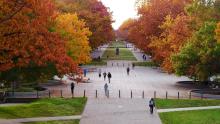
Why does B.C. put on a dimmer autumn leaf show than other provinces? UBC botanist Dr. Santokh Singh explains, and highlights his favourite leaf-viewing spots. read more
February 18, 2025
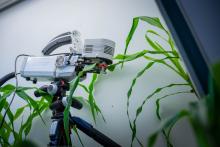
Plants play a key role in regulating Earth’s climate, but recent research suggests that rising temperatures could disrupt this balance, because plants are leaking more water than previously thought.UBC assistant professor Dr. Sean Michaletz, a newly minted Sloan Research Fellow in the department of… read more
June 25, 2024
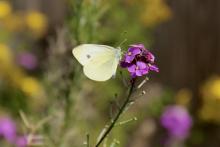
A wet, cool spring and spraying for invasive insects may be the reasons behind a drop in butterfly sightings this year. iNaturalist, an online service where anyone can upload their pictures or observations of plants and animals, records about 400 observations of 22 species of butterflies in… read more
We honour xwməθkwəy̓ əm (Musqueam) on whose ancestral, unceded territory UBC Vancouver is situated. UBC Science is committed to building meaningful relationships with Indigenous peoples so we can advance Reconciliation and ensure traditional ways of knowing enrich our teaching and research.
Learn more: Musqueam First Nation